Multiple Linear Regression Model for Ontario Temperature
Hypothesis
The three variables (lat., long., elev.) will be analyzed and determined whether each of them has significant relationship/influence to the Ontario mean annual air temperature (MAAT).
In this case, the null hypothesis for this dataset H0 should be defined as: All coefficients are equals to zero, except for the intercept ( Lat= Long= Elev=0). Therefore, there is no significant influences on the MATT. As for the alternative hypothesis, it should be opposite to H0: at least one of the coefficients is not equal to zero ( Lat+ Long+ Elev 0). Thus, there are significant relationship between lat./long./elev. and MAAT.
Assumptions and Conditions
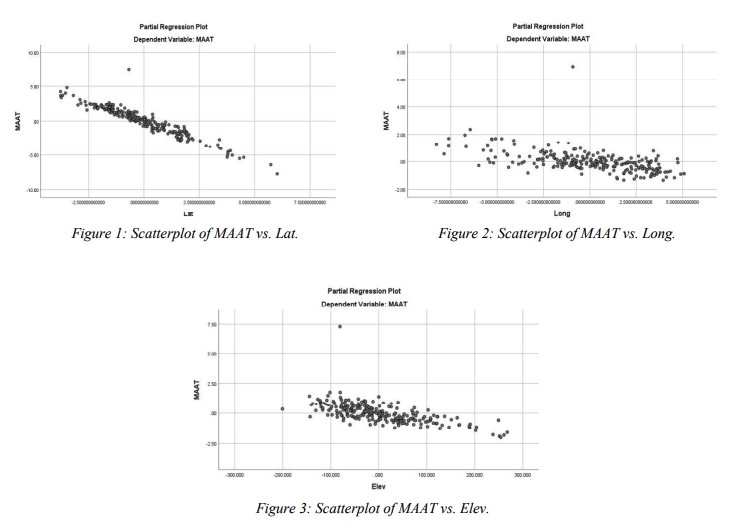
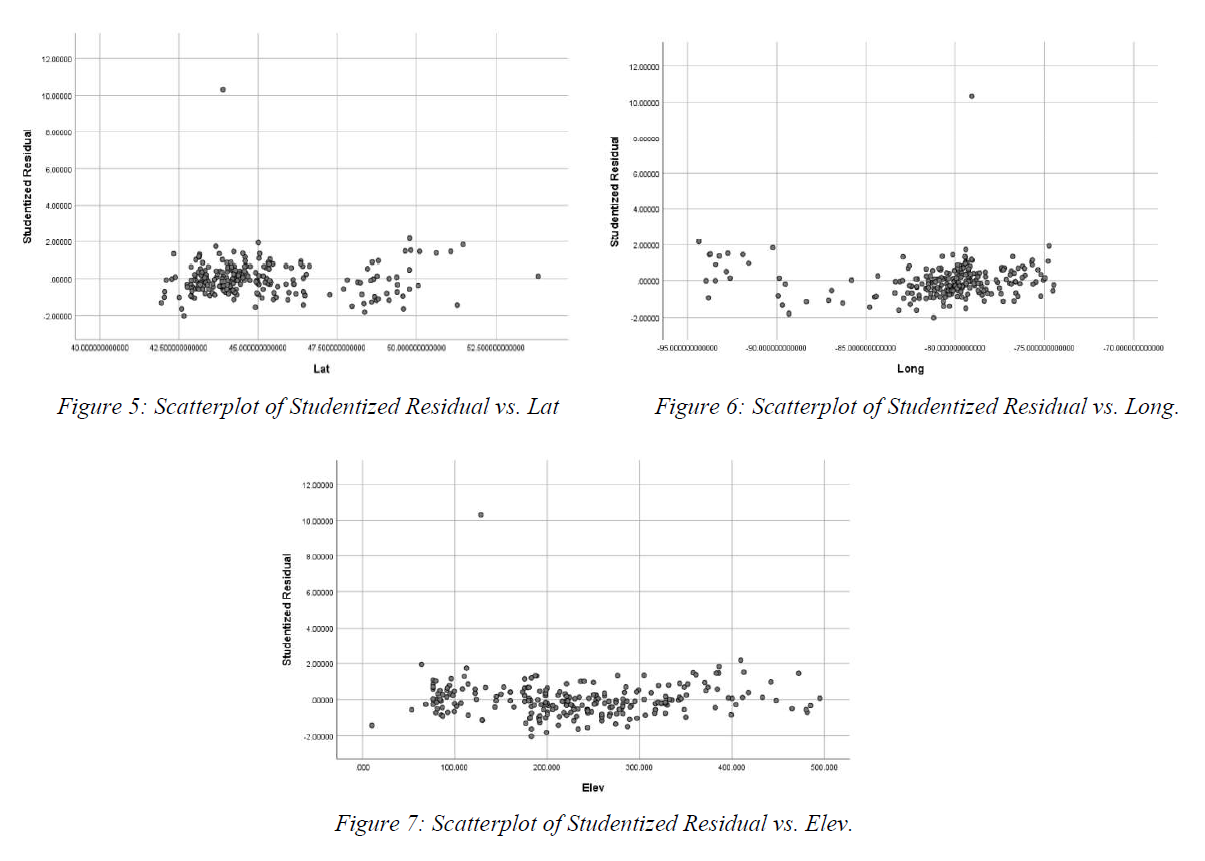
Linearity Assumption (Straight Enough Condition): According to Figure 1, Figure 2 and Figure 3, there are no obvious bends in the scatterplots of MAAT vs. either of its 3 variables (lat./long./elev.) Although there is an outlier appears in each of the graph, this would not affect the linearity of the data. Besides, the scatterplot shown in the Figure 5 indicates that there is no obvious pattern would suggest non-linearity.
Independence Assumption (Randomization Condition): There is no reason that the latitude/longitude/elevation at one place can cause effects towards latitude/ longitude/elevation of any other places. Also, MAAT should be independent since one's temperature cannot influence others. (there are no obvious patterns in the Figure 4 indicates that the temperature (MAAT) of one station can influence one another.) Therefore, these data can be considered as independent one, and thus randomization condition can be assumed.
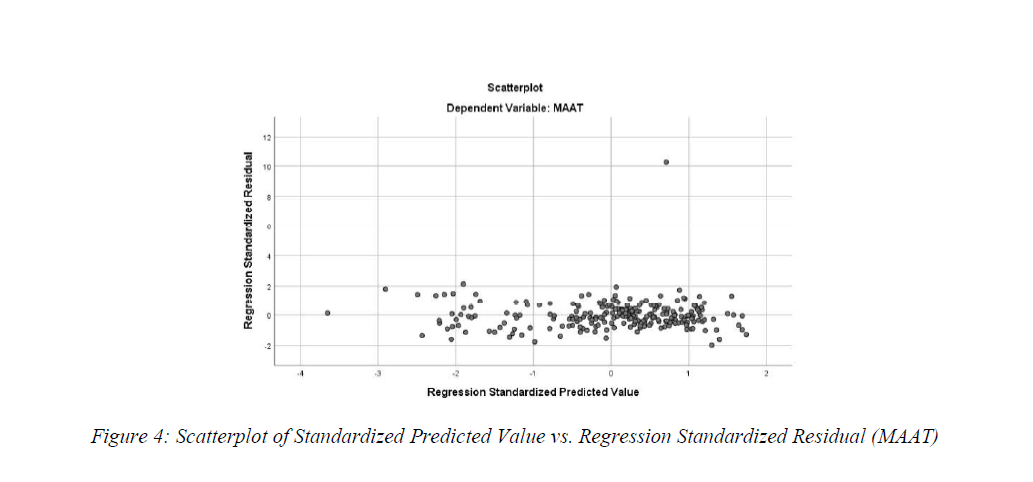
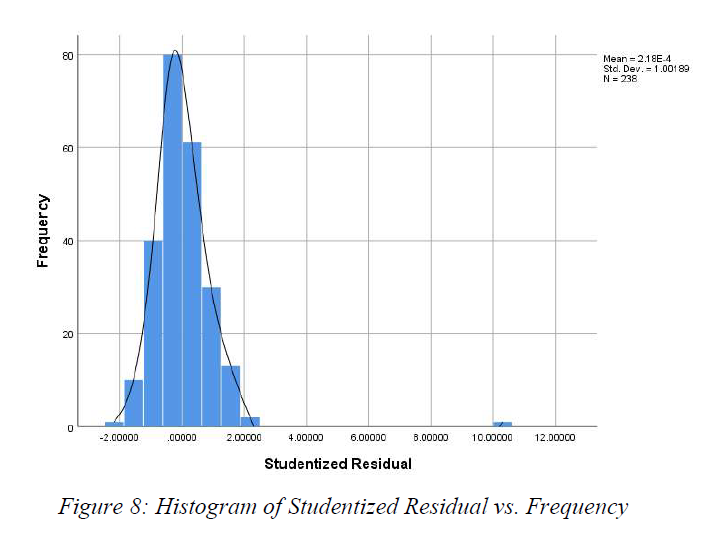
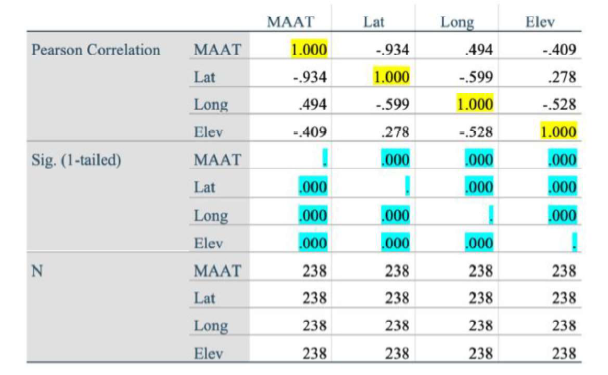
Equal Variance Assumption (Does the plot thicken? Condition): Figure 4 shows that there are no significant changes in the data's spread. Also, Figure 5, 6 & 7 indicates that there is no significant relationship between studentized residual and the 3 explanatory variables (lat./ long./elev.). Therefore, thicken condition (equal variance) can be assumed.
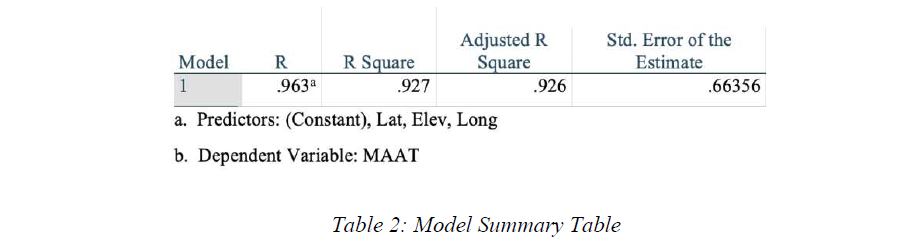
Normality Assumption (Nearly Normal Condition - outlier Condition): Figure 8 illustrates that the spreading of the data (distribution) is unimodal and very symmetric. Besides, there is no obvious patterns suggest non-normality. However, there is a outlier appears at around 10,0000 on the studentized residual axis. Therefore, although nearly normal condition is met, the outlier condition suggest that the data is not satisfied the normality assumption due to the outlier.
Multiple Linear Regression Model
Variable Prediction: In the table 1, it evaluates the relationship between the response variable, which is MAAT and its three explanatory variables (Lat, Long, Elev) by examing the Pearson Correlation and test-significance about them. The data highlighted in yellow can be ignored since them means the correlation to themselves. According to the data in table 1, the relationships between MAAT and its explanatory variable is strong and significant mainly due to 2 factors:
1. Significant values are all less than 0.05. The sig. values are all highlighted in blue, and all of the sig. values are <= 0.0001.
2. The correlation between variables are either near 1/-1 or equidistant of 1/-1 and 0. The linear relationship of MAAT vs. Lat. are strong since the R is -0.934, which is near -1. The linear relationship of MAAT vs. Long and MAAT vs. Elev is medium strong. (Rlong is 0.494 which is around the middle between 0 and 1, and Relev is -0.409 which is around the middle between 0 and -1.)
According to Table 2, the overall correlation is 0.963, which indicates that there is strong positive relationship (R=0.963) between MAAT and its 3 variable lat, long and elev.
Linear Regression Equation
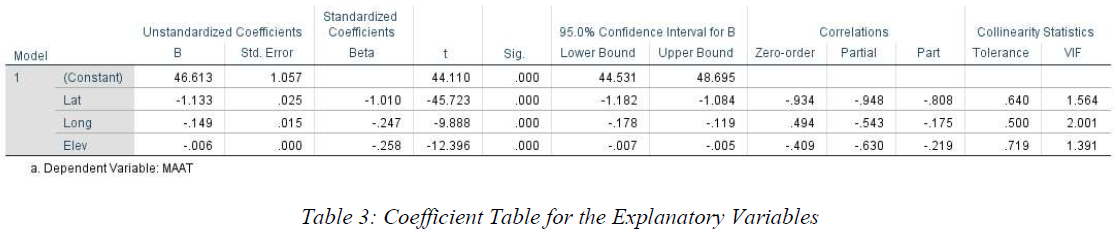
The important coefficients can be gathered from Table 3. The general form of the regression equation should be look like:

Therefore, the regression equation for this scenario is:

According to the Table 3, the unstandardized B is the main coefficient for this equation, and B for constant is corresponds to beta 0, B for Lat should be beta 1 and the rest can be done in the same manner. With substituting the value from Table 3, the equation should be:

Interpretation about MLR Model
Based on the data from Table 3, the relationships between the dependent (response) variable MAAT and
independent (explanatory) variables Lat/Long/Elev can be interpreted as following:
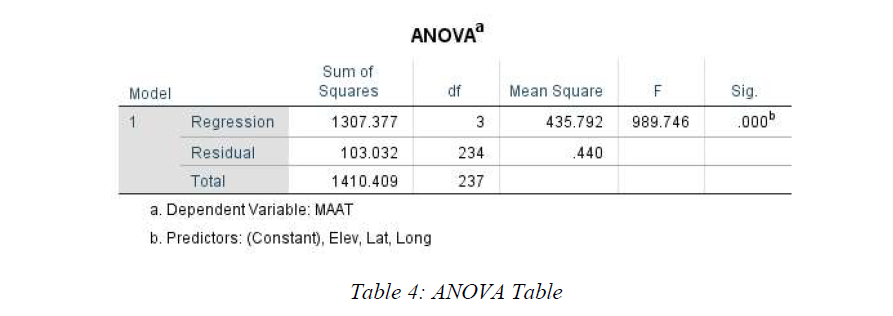
F-Statistics:
F is equals to 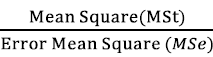 , it can used to determine whether the null hypothesis should
be rejected. The larger the F is, the larger possibility that the null hypothesis should be rejected. In this case,
since we can know F value is 989.746 from Table 4 (ANOVA table) which is much larger than 1. Thus, we
should reject the H0.
R Square:
According to Table 2, R2 is 0.926-0.927, It is predicted that about 92.6%-92.7% of the variability of the
MAAT can be presented in the data.
, it can used to determine whether the null hypothesis should
be rejected. The larger the F is, the larger possibility that the null hypothesis should be rejected. In this case,
since we can know F value is 989.746 from Table 4 (ANOVA table) which is much larger than 1. Thus, we
should reject the H0.
R Square:
According to Table 2, R2 is 0.926-0.927, It is predicted that about 92.6%-92.7% of the variability of the
MAAT can be presented in the data.
Relationship between MATT vs. Lat/ Long/ Elev:

- Latitude: As moving 1 degree away from the equator positively to north (northing), the MAAT will decrease 1.133 degree Celsius. - Longitude: As moving 1 degree away from the prime meridian negatively to west (westing), the MAAT will decrease 0.149 degree Celsius. - Elevation: As moving 1 meter away from the horizon line (upwards), the MAAT will decrease 0.006 degree Celsius.
Confidence Interval
For latitude moving one degree to north, there are 95% level of confident that the mean proportion of MAAT decreases between 1.084 and 1.182. For longitude moving one degree to west, there are 95% level of confident that the mean proportion of MAAT decreases between 0.119 and 0.178. For elevation moving one meter above, there are 95% level of confident that the mean proportion of the MAAT decreases between 0.005 and 0.007.
Hypothesis
Since the F-statistics is 989.746 (much larger than 1), and P-value from Table 4 is smaller or equals to 0.0001, which is < 0.05. Therefore, the Null Hypothesis H0 should be rejected. (There is strong relationship between MATT and its three variables.)